Fitting Logistic Growth Rate With Optim()
Fitting logistic growth rate with optim()
[2021-03-26]

Given a logistic growth function of the form:
logistic_func = function(y_max, k, t0, t){
    y_max / (1 + exp(-k*(t-t0)))
}
where y_max is the maximum level reached (e.g. maximum biomass or maximum number of individuals in a population), k is the maximal growth rate, t0 is the time at which the growth rate is at maximum, and t is the time. We can fit our growth data as a logistic function of time using the cost function:
cost_func = function(par, data){
    y_max = par[1]
    k = par[2]
    t0 = par[3]
    t = data[,1]
    y = data[,2]
    y_pred = logistic_func(y_max=y_max, k=k, t0=t0, t=t)
    return(sum((y-y_pred)^2))
}
We can use R’s optimisation function optim() while being mindful of the minimum and maximum possible parameter values, i.e. try not too use infinities in the lower and upper bounds of the parameter search space.
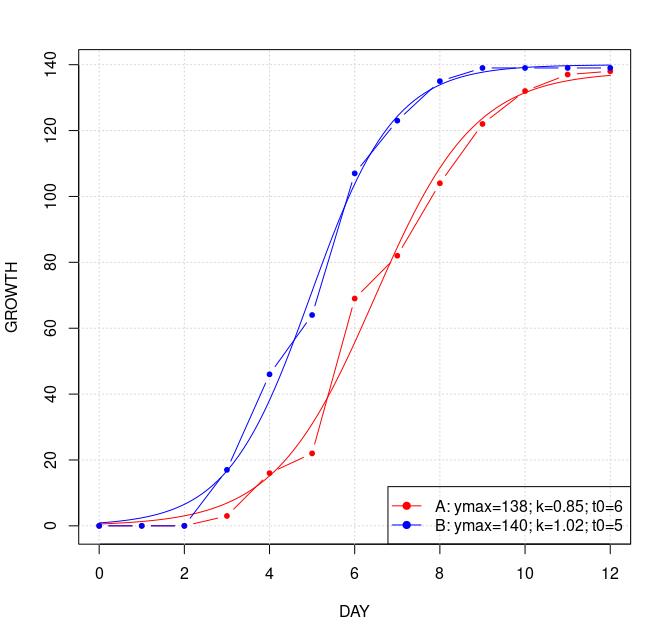
To illustrate, given the following growth data across 13 days on 2 treatments:
TRT = c("A", "A", "A", "A", "A", "A", "A", "A", "A", "A", "A", "A", "A", "B", "B", "B", "B", "B", "B", "B", "B", "B", "B", "B", "B", "B")
DAY = c(0, 1, 2, 3, 4, 5, 6, 7, 8, 9, 10, 11, 12, 0, 1, 2, 3, 4, 5, 6, 7, 8, 9, 10, 11, 12)
GROWTH = c(0, 0, 0, 3, 16, 22, 69, 82, 104, 122, 132, 137, 138, 0, 0, 0, 17, 46, 64, 107, 123, 135, 139, 139, 139, 139)
We fit these data on a logistic function by finding the optimum parameter values:
vec_colours = list(A="red", B="blue")
vec_ymax = c(); vec_k=c(); vec_t0=c()
plot(x=DAY, y=GROWTH, xlab="DAY", ylab="GROWTH", type="n"); grid()
for (trt in c("A", "B")){
    optim_out = optim(par=c(1, 1e-4, 1),
                    fn=cost_func,
                    data=cbind(DAY[TRT==trt], GROWTH[TRT==trt]),
                    method="L-BFGS-B",
                    lower=c(0, 1e-8, 0),
                    upper=c(200, 3, 12))
    y_max = optim_out$par[1]
    k = optim_out$par[2]
    t0 = optim_out$par[3]
    ### plot
    t = seq(min(DAY[TRT==trt]), max(DAY[TRT==trt]), length=100)
    y_pred = y_max / (1 + exp(-k*(t-t0)))
    points(x=DAY[TRT==trt], y=GROWTH[TRT==trt], type="b", pch=20, col=eval(parse(text=paste0("vec_colours$", trt))))
    lines(x=t, y=y_pred, col=eval(parse(text=paste0("vec_colours$", trt))))
    vec_ymax=c(vec_ymax, y_max); vec_k=c(vec_k, k); vec_t0=c(vec_t0, t0)
}
legend("bottomright", legend=c(paste0("A: ymax=", round(vec_ymax[1]), "; k=", round(vec_k[1],2), "; t0=", round(vec_t0[1])),
                               paste0("B: ymax=", round(vec_ymax[2]), "; k=", round(vec_k[2],2), "; t0=", round(vec_t0[2]))),
       col=unlist(vec_colours), pch=19, lty=1)
